Marina Map
Dockwa, part of The Wanderlust Group, is a marina management platform, focusing on finding efficiencies for marina operators and bettering boaters overall experience on the water.
Team
Product: Lead PD (Margo Sultenfuss), Product Designer, Product Manager
Engineering: 4 Engineers, 1 Tech Lead
External Agency: Klimt & Design, Upwork
Stakeholders: CEO, GTM leadership, VP of Product, VP of Engineering
Problem
Marinas utilize marina maps to determine the availability of slips and manage day-to-day operations. The industry standard is to use a physical map, taking the form of a large in-office whiteboard or, more frequently, a binder with a marina map printed out for each day of the year. These maps are then manually filled out and edited every day.
This process is extremely inefficient and time consuming, introduces many opportunities for human-error and does not allow for true occupancy maximization at the marina.
Example of an active marina map
Goals
By creating an interactive visual representation of a marina’s boat reservations and assignments to help with day-to-day operations at the marina, we wanted to see…
Increase nights booked in the Dockwa system: This was Dockwa’s North Star Metric. Customers were not importing all of their contracts or reservations into Dockwa’s system, as it was easier to manage some of these reservation types manually.
Drive upgrades and purchases: As this was going to be a paid add-on feature, we wanted to see an increase in customer upgrades or net new conversions.
Decrease time spent updating marina map per day: Dockmasters spend on average 2 hours a day updating and editing their physical marina maps. By introducing an automated and digital mapping system, these users should no longer need to keep a physical map or manually input updates.
Discovery
Screening Criteria
As marina maps are used universally, we wanted to talk to a wide range of marinas, ideally with more complex operations.
Marina size: small (>50 slips), medium (between 50 and 200 slips), large (over 200 slips)
Geographic location: New England, Florida, California
Marinas who held both long term contract and transient/ short term reservations
Marinas with several types of storage: boat slips, dry stack/warehouse storage, moorings
We interviewed 10 different marinas, learning the following:
Each marina has an extensive list of map details and color coding techniques representing different statuses and physical attributes such as boat type, daily arrivals and departures and unpaid balances.
Boat length, boat depth, slip size and power pedestal locations were universally needed to use the maps.
Dockmasters regularly spend 1 hour before and after work each day correcting the maps and copying reservations from the digital system.
As edits were made erasing reservations and comments, there were no historical records for edits or cancellations.
Dockmasters often became bottlenecks in marina operations as they managed the marina map binder.
Marinas saw the main purpose of the map to first, maximize dock space and usage and secondly, improve operations and customer service.
Solution
Create an interactive visual representation of a marina, layering on Dockwa’s existing reservation and assignment data, to assist Dockmasters in maximizing dock usage.
Timeline
The marina sales cycle is extremely seasonal, taking place primarily in the Fall. In order to have ample time to test and iterate on this product before the next selling and upgrade cycle, we wanted to roll out an MVP to beta customers within 2 months (November ‘22).
Technical Feasibility and Limitations
Working with my engineering team and product manager, we quickly discovered that layering Dockwa’s reservation and assignment data onto a new view would be quick and easy. The problem was automating map creation and telling the reservation data where to be visually placed on the map.
Designs
To start, I facilitated two Crazy 8 exercises with my pod of 3 engineers and 1 product manager with the following prompts:
How are maps created and added into Dockwa for each marina?
In order to have an interactive map in Dockwa we’d need to layer our existing data on top of a map. How can users add this data to their map?
After sitting with the results and working through my own initial design process based on technical constraints and guardrails determined with my engineering team, three main areas of design emerged:
Map creation: In-house product designers would create standardized marina maps in Figma using the customers’ existing marina maps and Google satellite images. These maps were created using a Figma component library with stylized marina and dock elements and auto-layouts and exported as SVGs.
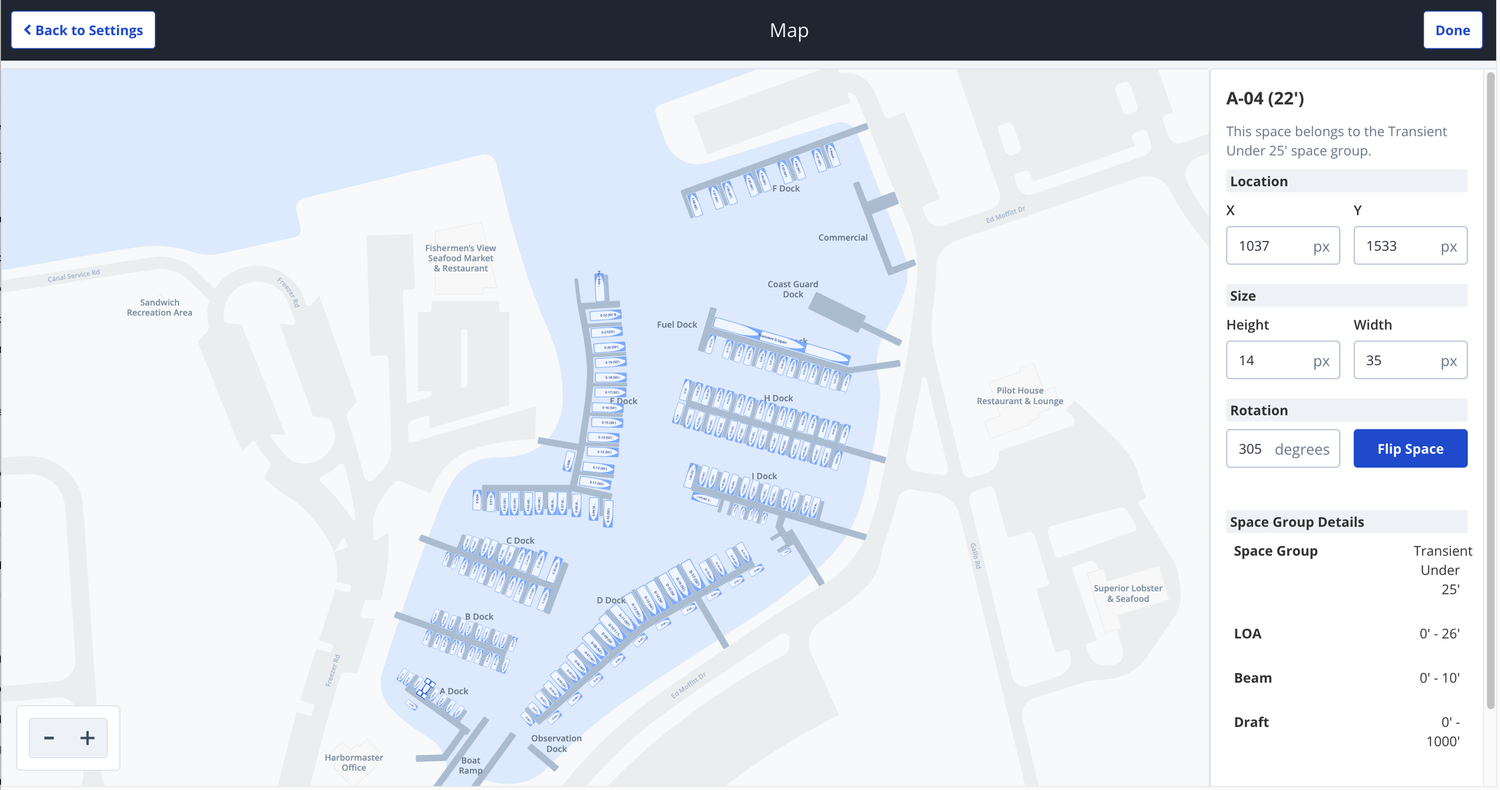
Map annotation*: The SVG would be imported by the marina’s Customer Success Manager (CSM) into a new page in Settings. The CSM then manually drags the marina’s already defined boat slips on the image in the correct location.
Customer-facing Map View: After the CSM finishes annotating and publishes, the customer will now have a new view in their Assignments tool.
*Annotation - manually adding the marinas slips and storage spaces to the map
Future Designs
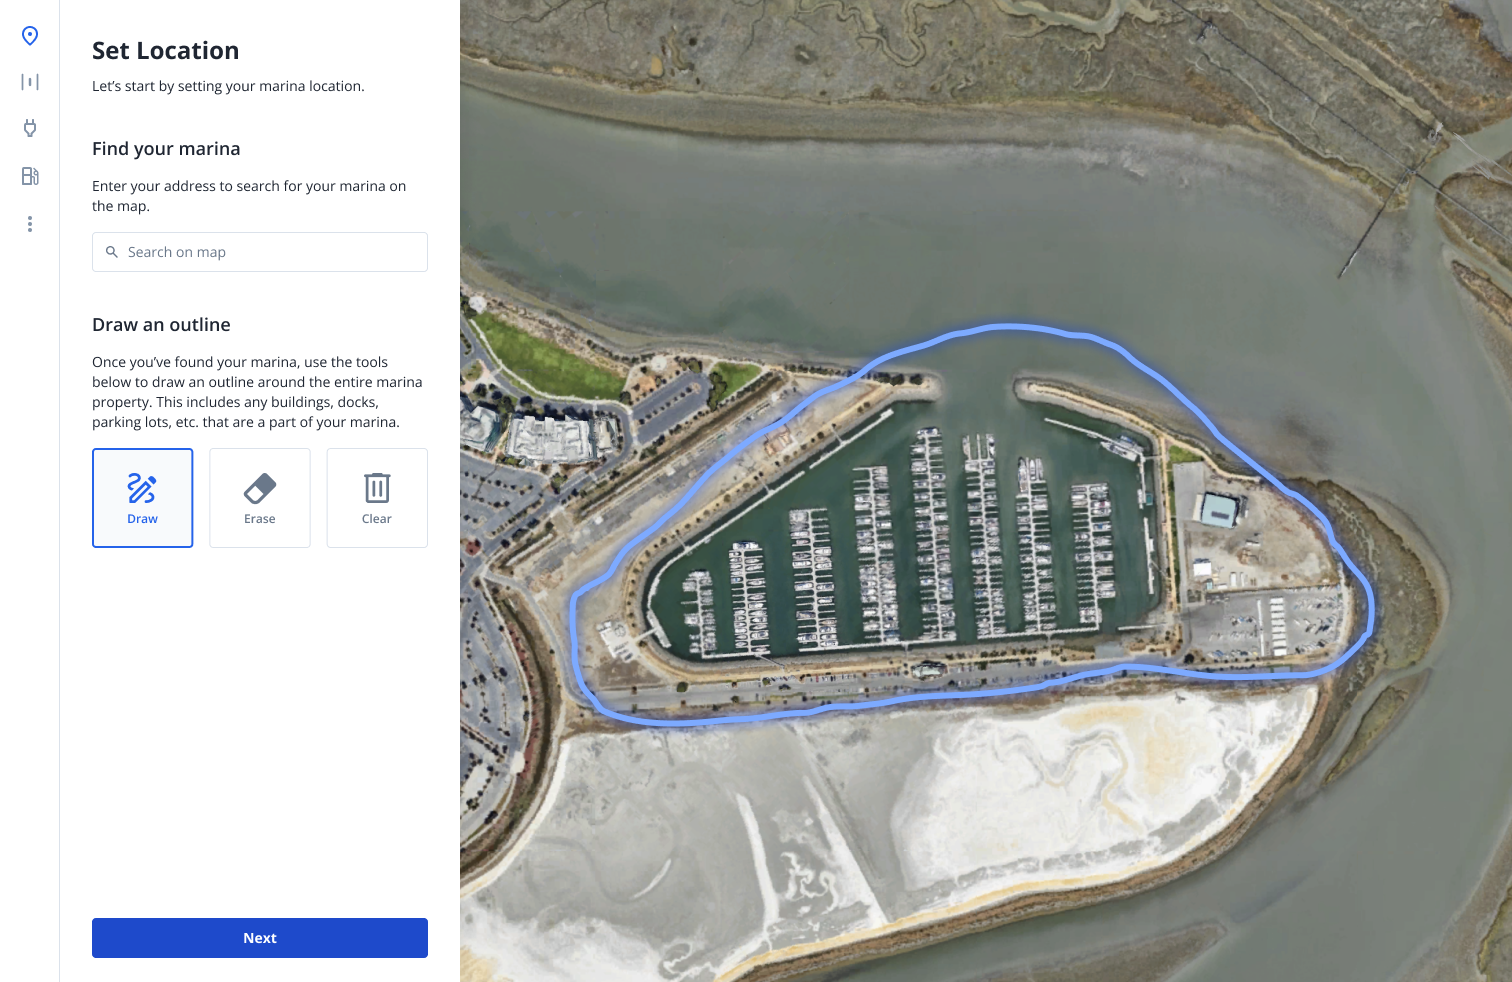
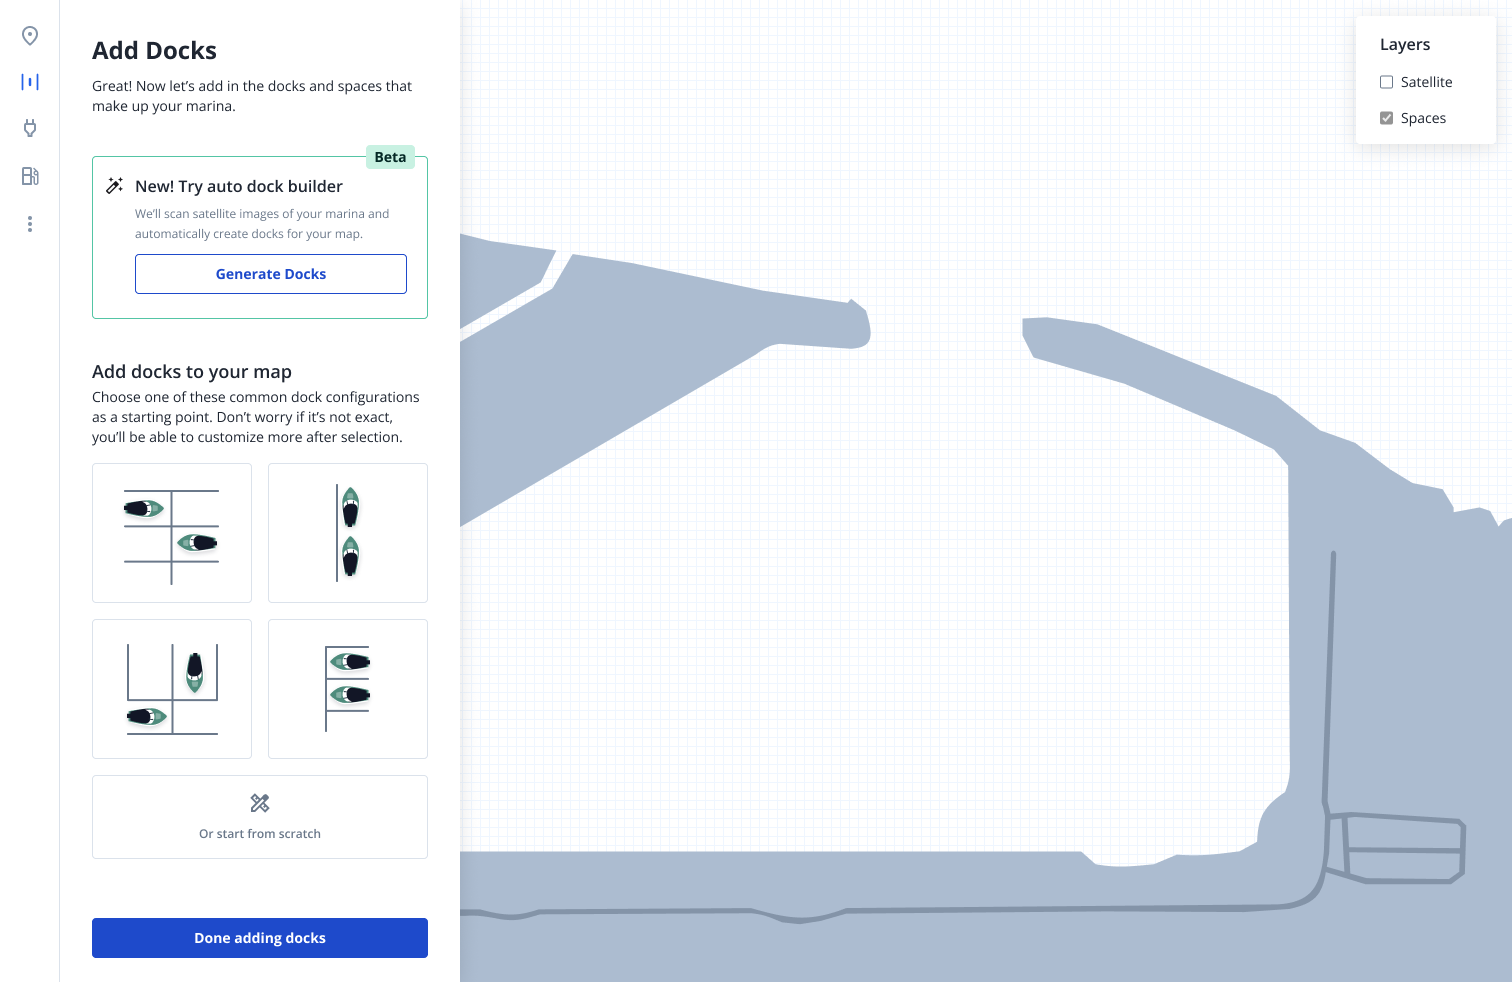
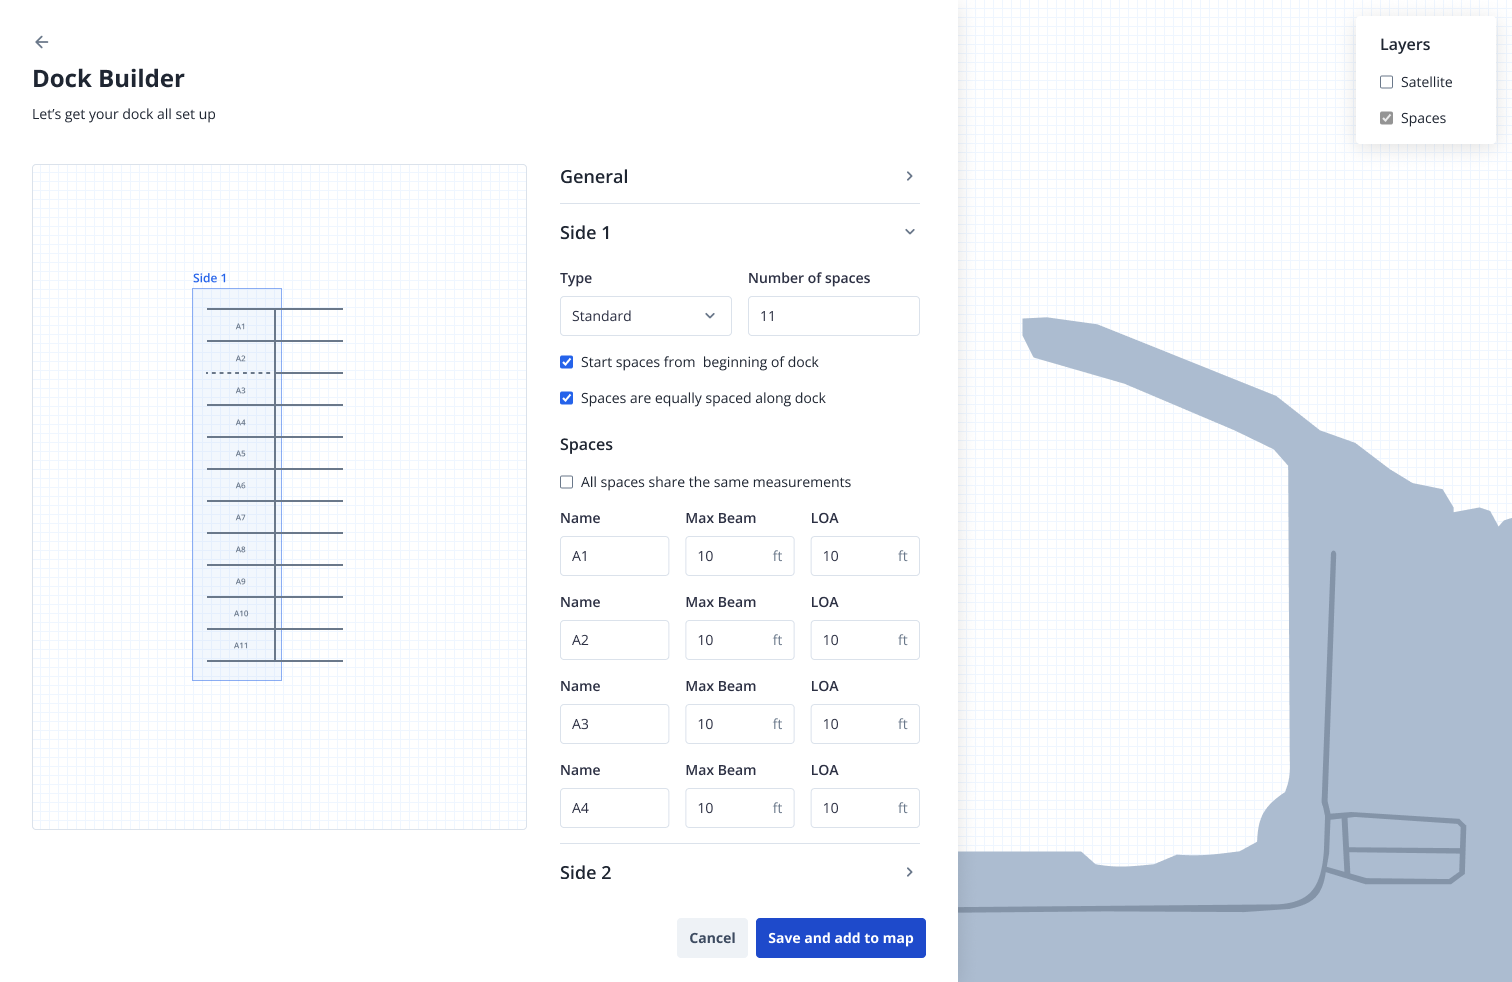
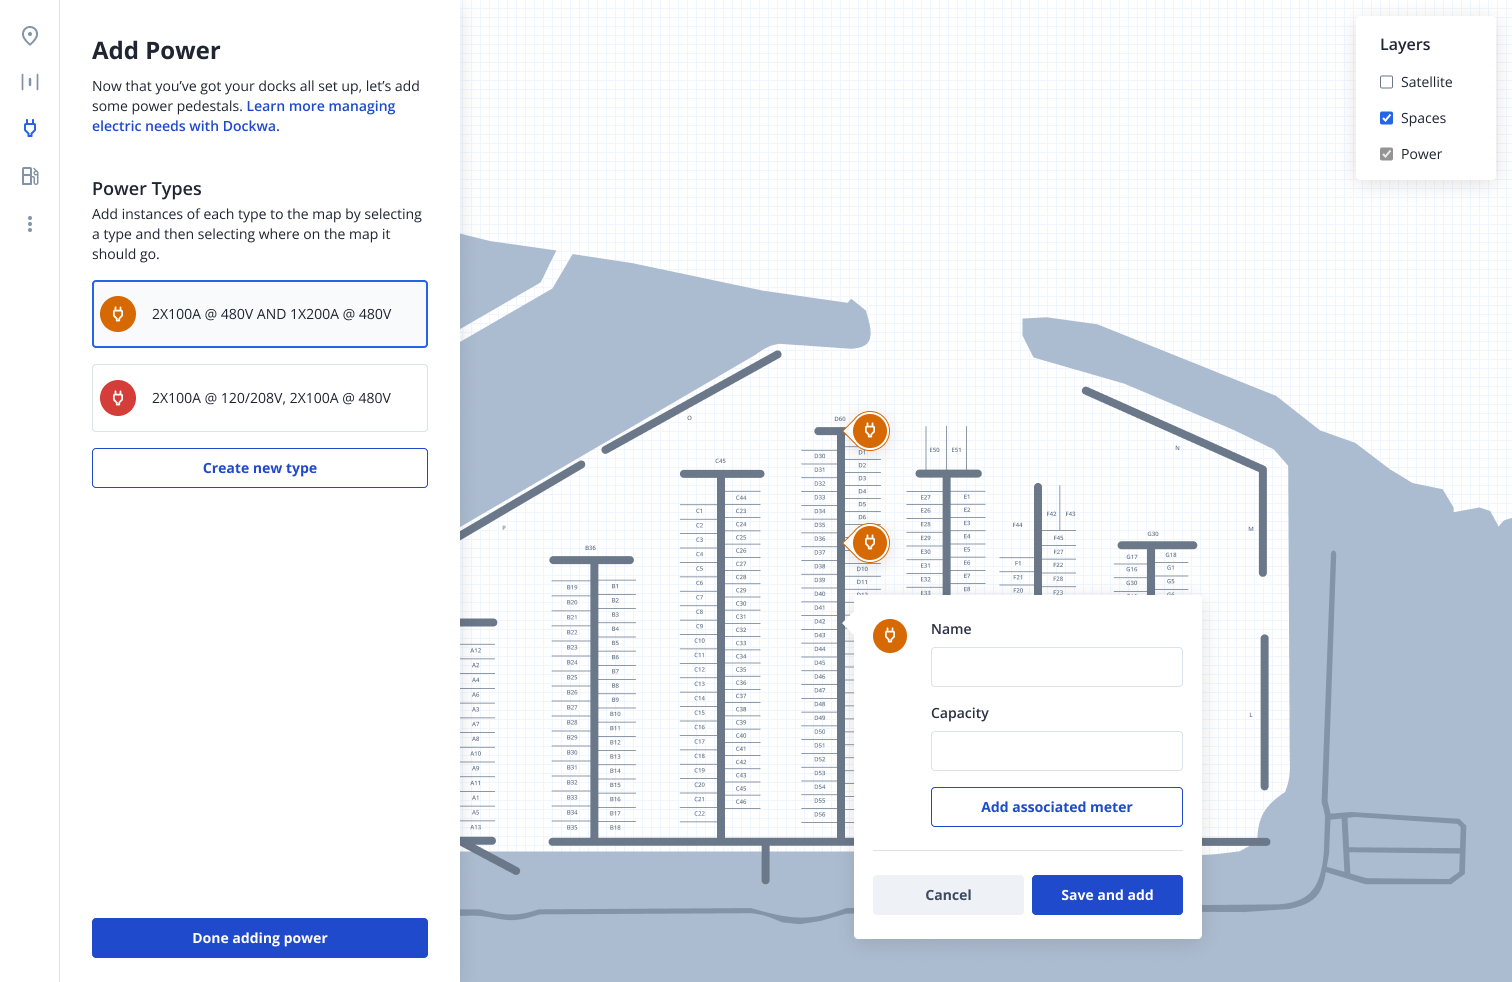
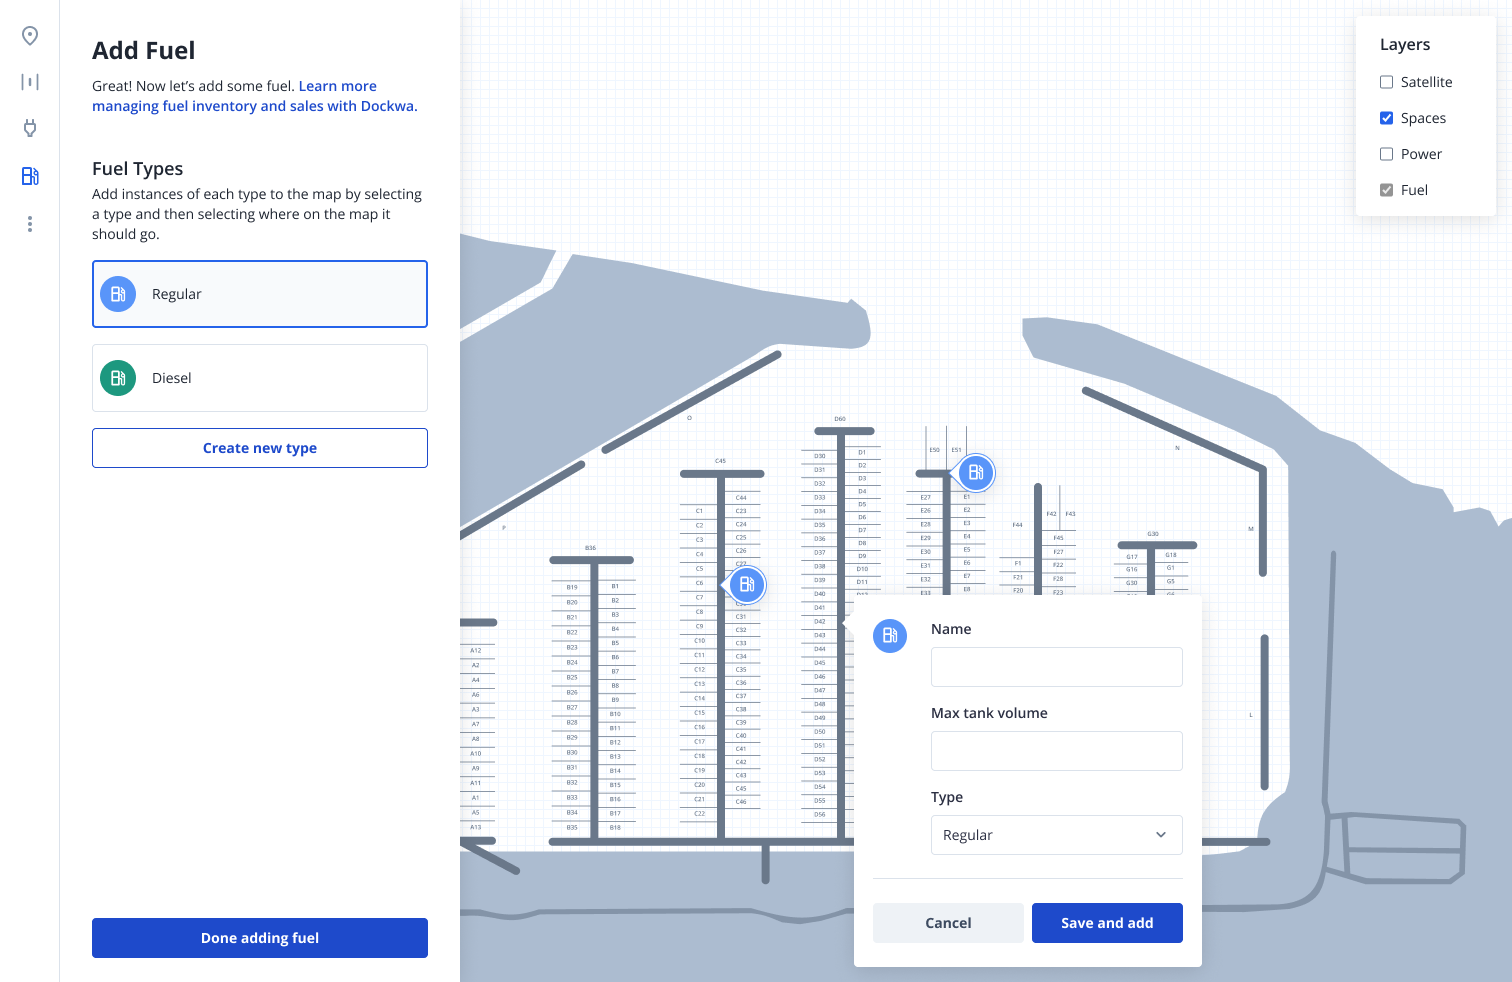
The end goal for the Marina Map would be to fully integrate other highly used Dockwa feature into the map visually and also put the map creation fully in the hands of the customer, making the map creation process self-service and editable by the end user. These future ‘pie-in-the-sky designs were built using our new design system and component styling which hadn’t yet been rolled out in production.
Iterations
Knowing where we wanted to go, we simplified the designs as much as possible for our MVP, taking out the self service aspect. We learned the following as we received initial user feedback: we learned the following.
Custom color coding: We quickly learned that marinas were not going to fully utilize the maps unless given enough flexibility to include their own custom color coding. We introduced the ability to create up to 8 custom codes, which would automatically be applied to the slip.
Auto-annotating slips: Time spent in the Annotation phase continued to rise, from 4 to 16 days because of an increase in marina map requests and increase in the size of marinas. The more slips at a marina, the longer it took to annotate. Looking for a way to automate the annotation process, we realized we could customize the SVG image once uploaded, and a new process emerged.
Using Figma’s auto-layout feature during the map creation process, Design included a bright yellow box where each slip would be placed on the map by a CSM. Upon upload, the tool would recognize and then replace each yellow box with a boat slip. Now, CSMs simply needed to match each boat slip to the correct name, rather than create and place each boat slip, significantly decreasing the time to annotate.
Varied Map Types: As more varied marinas request the maps, we’ve needed to implement different styles and types of maps beyond dockage, such as Dry Stack (boat warehouses), Parking Lot storage, and Mooring fields. We will continue iterating on the best UI for each of these.
MVP Designs
Manual Annotation phase: adding boat slips to SVG
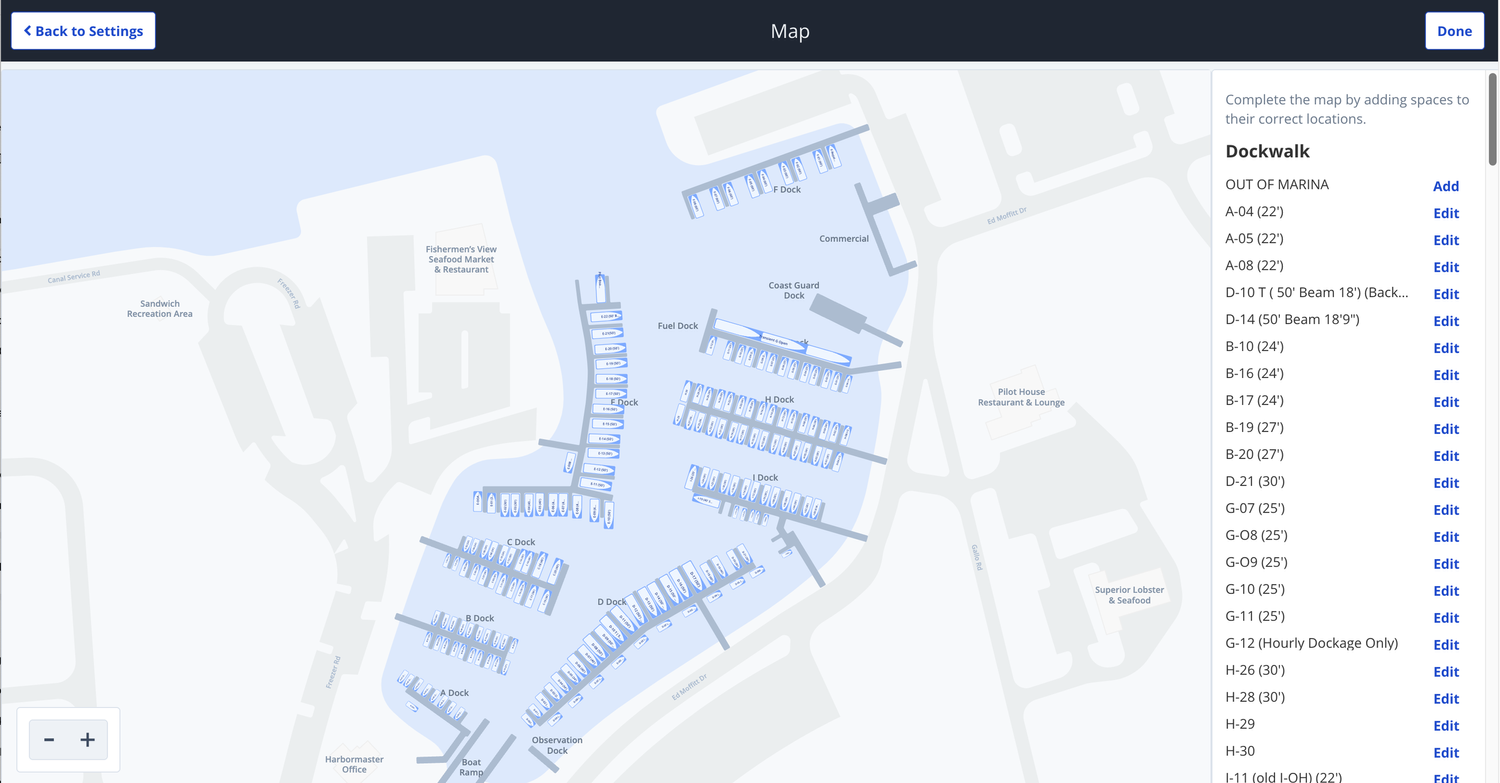
Manual Annotation phase: list of all marina slips added to SVG
Customer facing view: Existing list view of assignments
Customer facing view: New map view of assignments
Results
As of November 2023, this project was the most successful feature at Dockwa.
We rolled Maps out to 208 marinas with over 260 maps published.
18% upgrades and purchases: We beat our goal of 10% customer upgrades or purchases, with over 18% of paying customers either upgrading their tier or purchasing Dockwa because of Marina Map.
Time savings: Per the results of a survey, over 55 marinas were no longer using physical marina maps in their daily process, saving users over 10 hours per week.
Increase in nights booked in the system: While unable to directly tie increase in nights booked to marina map usage, Dockwa saw a marked increase in nights booked as marinas transitioned onto the new feature.
Process improvements and improved Time to Value: Over the 8 months, we have decreased the ‘In Design’ phase of map creation from 22 days to 5 days, a 77% decrease in time spent, through process automations, streamlining complete data collection from marinas and creating Figma components for map creation. By improving this process, we were able to get the tool into the hands of customers faster.
Due to current resourcing constraints, we haven’t yet been able to dedicate resources towards self-service.